Dash
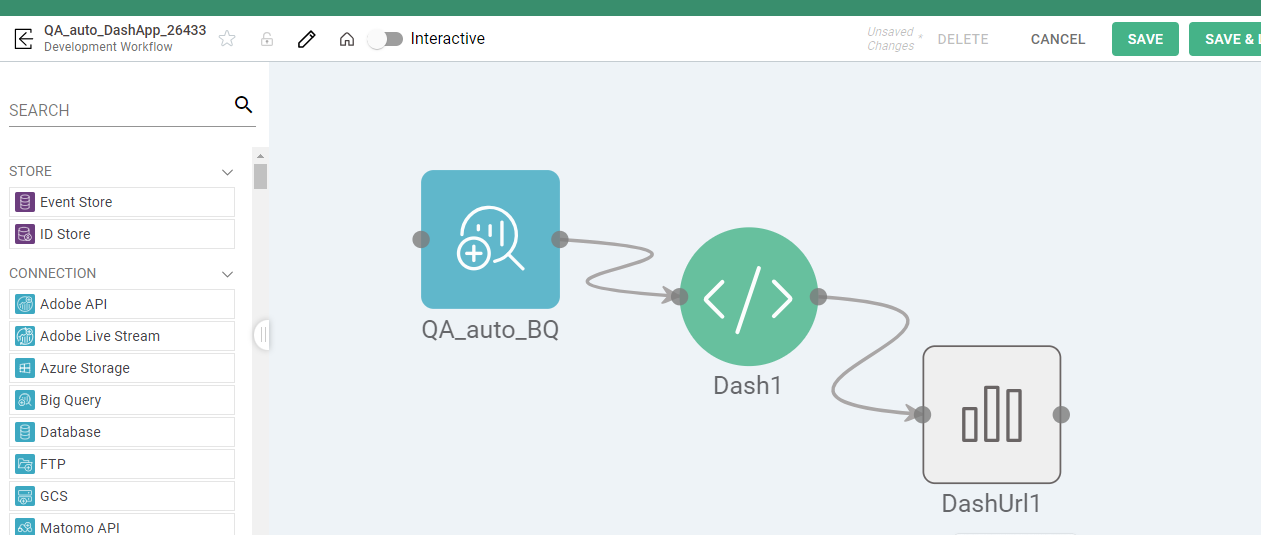
With a focus on visuals, the Dash Process enables data scientists to create dashboards from the data processed through their pipeline rather than just dataset tables. This is an additional tool that highlights data and turning this data into dashboards, adding to the capability of dashboards.
Process Configuration
Additional information, such as General, Code, and Output, must be included in order to configure Dash Process, all three mentioned below:
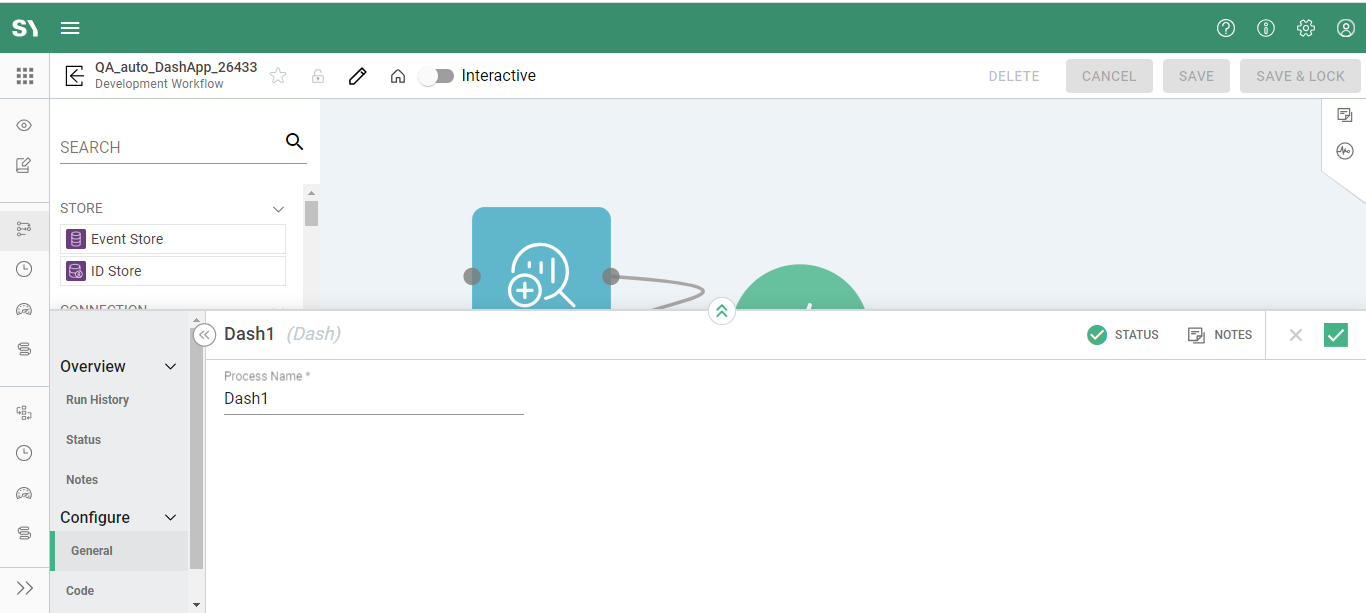
General
Process Name - Provide a descriptive name for the process, ideally beginning with a verb.
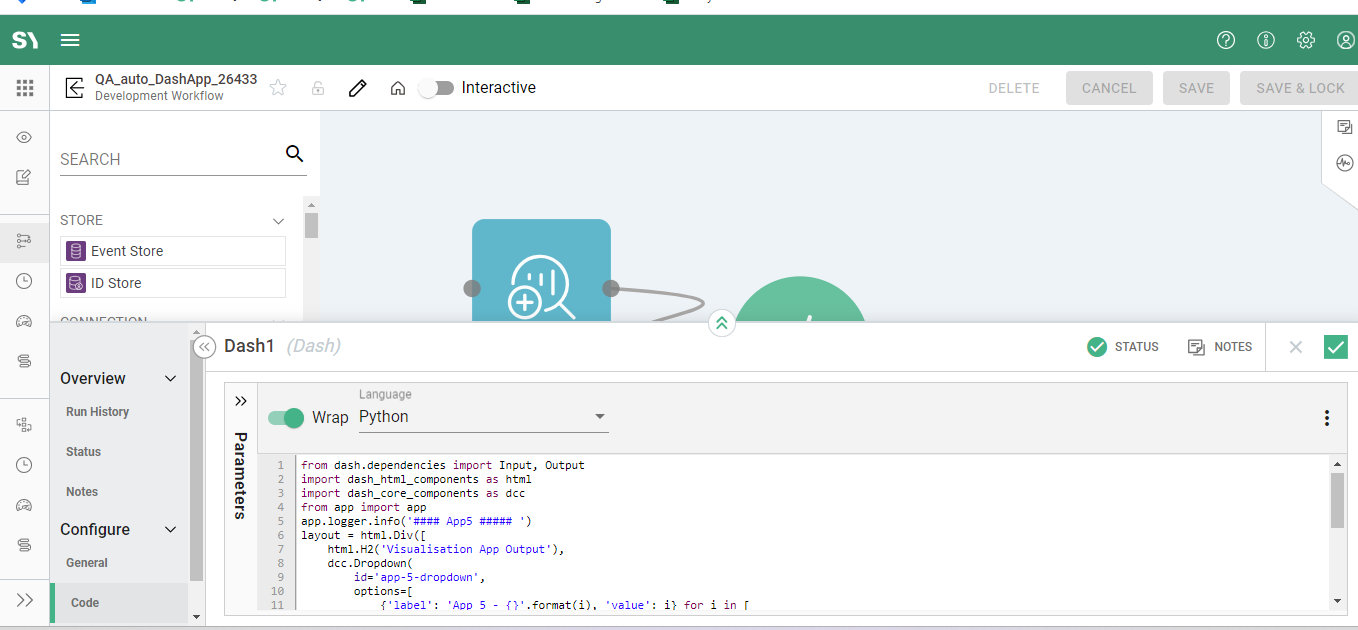
Code
Language - The following contains an example of Python code that runs a Dash processor:
from dash.dependencies import Input, Output
import dash\_html\_components as html
import dash\_core\_components as dcc
from app import app
app.logger.info('#### App5 ##### ')
layout = html.Div([
html.H2('Visualisation App Output'),
dcc.Dropdown(
id='app-5-dropdown',
options=[
{'label': 'App 5 - {}'.format(i), 'value': i} for i in [
'NYC', 'MTL', 'LA'
]
]
),
html.Div(id='app-5-display-value'),
dcc.Link('Go to App 1', href='/TestModel/app1')
])
@app.callback(
Output('app-5-display-value', 'children'),
[Input('app-5-dropdown', 'value')])
def display_value(value):
return 'You have selected "{}"'.format(value)
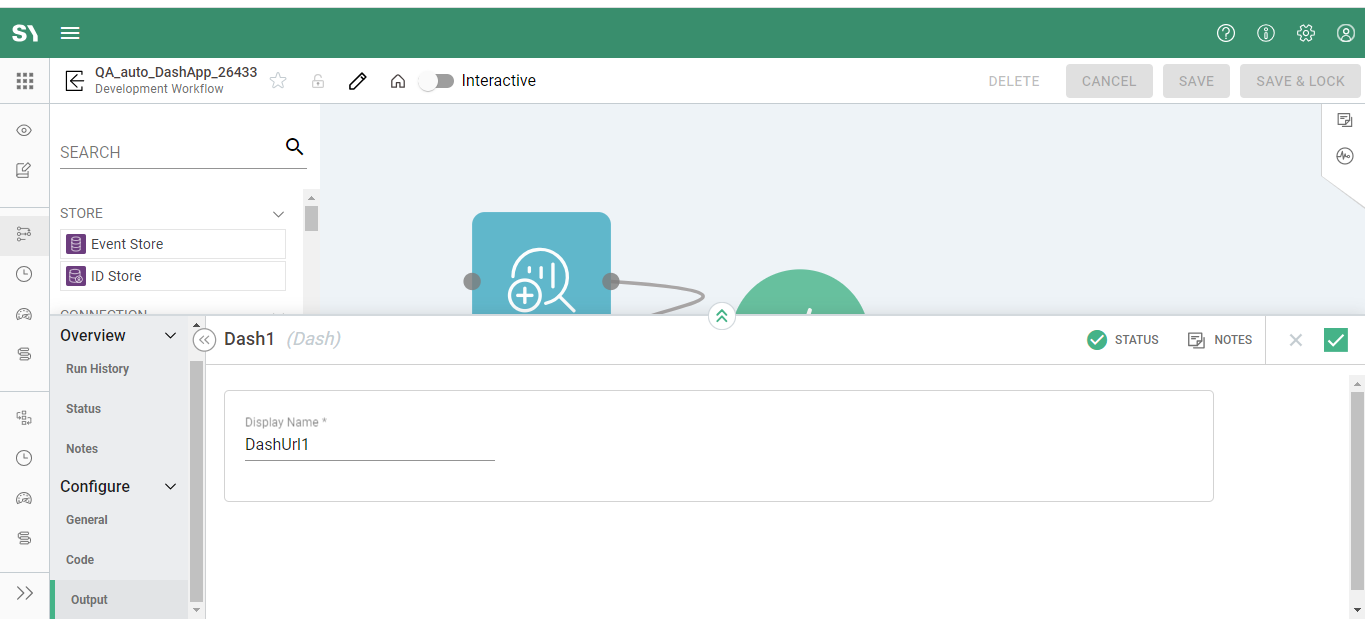
Output
Display Name - In last if you wish to Change the default Display Name value, this is possible using this Output tab. You can alter the default Display Name value using the Output tab.